Date

2024

Industry

Technology

Client

Basesite

Services

Brand Identity
UX / UI
3D
Webflow Development

Basesite is a revolutionary startup behind the Fabbuilder software product for major semiconductor fabs. It automates fab building with AI optimizers, allowing to cut major weeks of time, millions of dollars, and many errors from the project delivery, but without cutting corners.

Celerart created a comprehensive brand identity from the ground up, including a bespoke versatile logo, custom graphics, animations, 3D, and a set of corporate identity collaterals.

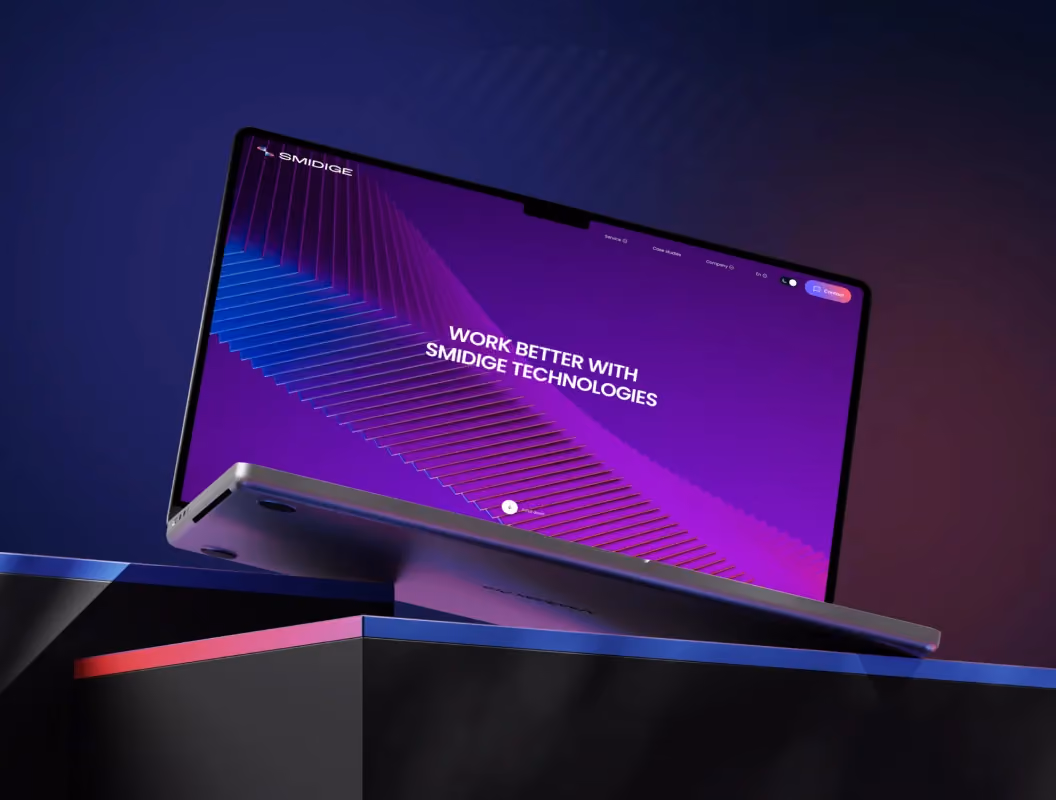
We also designed an awesome website that tells a story in an engaging way, presenting a complex concept through interactive animations, clearly communicating the whole deal, making it easily digestible. As usual, we built it with Webflow, leveraging best practices and client-first approach, allowing for excellent performance and convenient management.

There's more cooking... We're crafting a whole new Fabbuilder app user experience. Coming soon.

Laptop displaying Basesite homepage with tagline "Cut Weeks From Your Project Delivery" and 3D building layout in a clean tech-focused layout
Vector construction of the Basesite logotype with bezier curves and labeled typographic guidelines on a purple background
Basesite brand color palette featuring vibrant purples and supporting shades with hex codes on a clean white background
Typography showcase for Basesite using Inter Tight font with character set and explanation of its use for display styles
Brand guidelines for Basesite showing cover, logo construction, and rules for correct logo usage on white and purple pages
Three floating violet envelopes with the Basesite logo in large typography on a black background
Architectural wall installation with Basesite branding and flow graphics, emphasizing engineering-focused messaging for construction software
Wireframe grid layout for Basesite stationery elements on a black background, showing alignment and spacing structure
Three smartphones display AI project delivery software benefits and client testimonials on modern user interfaces.
Tablet screen displaying "Semiconductor Leaders Trust Us" with world map highlighting Ukraine.
Close-up of iPhone screen with app icons on home dock, including App Store and Messages.
Basesite facilities optimization platform graphic for efficient building management solutions.
Contact form on tablet screen to speak with an engineer, blue background.
Billboard advertising building services design automation with AI, featuring statistics and modern graphics.
Semiconductor startup pitch deck slides with data visualization, automation, global expansion, and client insights.
Tablet screen displaying design automation software benefits, including saving money, time, and reducing rework.
Black oversized t-shirt with minimalist "basesite" logo on front, modern unisex streetwear style.
Minimalist purple business and technology line icons in a modern grid layout on white background.
Instagram profile of Basesite, semiconductor manufacturing solutions company, with 14.1k followers.
Purple drawstring bag with Basesite logo and geometric white line design for construction engineers.
Tablet displaying basesite data platform design automation engineering tasks workflow diagram.
Circular diagram showing program schedule support, optimized TPOCs, FPOCs, BIM 360, and GAP assessments.
Two rounded rectangle buttons labeled "How it works" and "Get in touch" with dimension guides.
Two smartphones displaying data cleaning and semiconductor industry information on white and purple screens.
Basesite branding with tagline, "Software for Construction Engineers built by Construction Engineers," on geometric background.
Interactive dashboard displaying data visualization and analysis on a tablet for power panel monitoring.
Geometric radius diagram with overlapping circles, grid lines, and pixel measurement labels in purple.
Minimalist error message displayed on a blank white screen, indicating a technical or loading issue.
Dashboard with electrical panel data visualizations, charts, and graphs for system analysis and reporting.